The year 2014 is sure to be another eventful one in mortgage finance. A litany of new regulations are prepared to be implemented, the economy is projected to improve, driving mortgage rates higher, and demand to refinance loans is expected to decline further. The overall size of the mortgage market, in dollar terms, is anticipated to be significantly smaller than in 2013. In light of these market conditions, one of the most discussed issues right now is the availability of credit for mortgage borrowers – is mortgage credit availability too tight? The importance of this question cannot be understated, particularly because of the impending implementation of the Qualified Mortgage (QM) standard and the mortgage market’s determination of the types of credit it will offer to borrowers.
Whether credit is too tight or too loose is an especially hard question to answer because there is no one single measure of credit availability. Nonetheless, it is possible to look at a variety of measures that collectively influence a borrower’s access to credit: borrower credit worthiness, loan-to-value (LTV) ratios, debt-to-income (DTI) ratios, the level of documentation, the propensity of adjustable rate (ARM) loans and the share of purchase-money loans.
To answer the question of whether each of these credit measures is too loose or too tight requires a determination of what would constitute a “normal” level of availability. For example, the average credit score of all originated first-lien purchase loans in October 2013 was 749. The average credit score over the year before the Federal Reserve announcement encouraging the use of ARMS in February 2004, and subsequently raising the federal funds rate, was 710. In percentage terms, this is only a 5-percent difference. The average doesn’t show us that the share of originated first-lien purchase loans in October 2013 with credit scores below 620 (typically ineligible under GSE guidelines) was 0.3 percent, but averaged 29 percent over the year before the Fed announcement. Credit to borrowers with low FICO scores was normally available prior to the beginning of the housing boom (as marked by the Fed announcement), but clearly is not currently. For each measure of credit availability, it is much more insightful to compare the share of the riskiest subset of the entire measure’s distribution to that same share prior to the housing bubble. Credit availability in each measure represents the extent to which lenders originate loans to the riskier subset of the distribution.
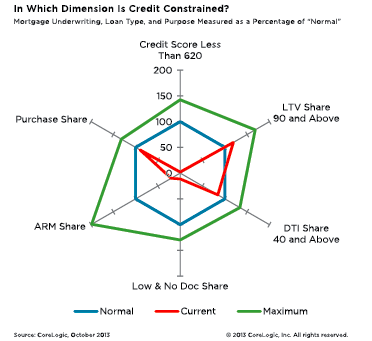
In the chart, each axis represents a different measure of credit availability. The inner hexagon crosses each axis at a value of 100, which is the reference point for the normal value for the measure illustrated on that axis, based on the average over the year preceding the Fed announcement in February 2004. For example, as described above, the share of first-lien purchase loans in October 2013 with credit scores below 620 was 0.3 percent, but averaged 29 percent over the year before the Fed announcement. Therefore, relative to a normal share of 29 percent, indexed to 100 and represented in the “normal” hexagon, the “current” unbalanced hexagon clearly shows the constrained availability of credit to low credit score borrowers. For each measure, the “current” and “maximum” unbalanced hexagons represent the deviation from normal for each measure both currently and at the loosest since the start of the housing bubble, respectively.
Immediately apparent from this chart is that credit availability is tight for two important underwriting criteria – credit scores and documentation levels. Low-credit-score loans are not being originated relative to the height of the expansion of credit or even at the normalized level of availability. Additionally, access to no- and low-documentation loans is significantly constrained relative to the height of expanded credit or the normalized level of availability. Underwriting eligibility in the current market requires good credit and the ability to fully document your loan.
Also interesting to note is that the shares of high-LTV and DTI lending are very close to normal. Both measures expanded availability during the housing boom. High-LTV lending currently remains modestly loose relative to normal and high-DTI lending is modestly tight relative to normal. The share of ARM loans being originated is currently much more restricted than normal, as many subprime ARM loan products are no longer available.
Looking at the share of the riskiest subset of an entire measure’s distribution compared to the share prior to the housing bubble for multiple measures gives more insight into the answer to the pressing question of whether credit is too loose or too tight. Right now, credit is tight for low credit score borrowers, those who don’t want to or can’t fully document their loans, or who would like an ARM product. For many, the choice to document or select an ARM product is not necessarily an impediment to credit availability, but for those with low credit scores there are fewer options.
—

Mark Fleming
Chief Economist
CoreLogic
www.corelogic.com
Leave a Reply